free html5 templates

Simulation

We believe that a great system design should hide complexities and minimise constraints on users expressing their creativity.

This belief has led Smart Microgrid to develop a unique and innovative solution that exploits spreadsheets as a simulation tool that enables non-programmers such as computer literate, business and engineering professionals to construct complex synthetic models without the need to know or write any computer code. We think this is an attractive capability for a number of reasons:  

Powerful Platform

Spreadsheet is one of the earliest and most established computer logic programs. MS Excel for example has countless features and supports many 3rd party plug-ins, further increasing potentialites.

Collaborative Design  

Supports Microsoft Excel, Google sheets and Apple Numbers. Platforms such as Google sheets facilitate online multi user collaboration. 

Instant Verification

Users can test the behavior of the synthetic model by simply saving the spreadsheet. There is no need to maintain, debug or even view any code. 

Mobirise

How is this useful? 

01.

 Accurately size the equipment  

A simulation can accurately determine the optimal size and configuration of the Distributed Energy Resource (DERs) to achieve the most desirable outcome during the procurement phase. For example, the user can easily review the dynamic performance of a particular DER using the historic or live data stream from their specific location. Such capability helps the user confidently select of the appropriate DER for their site. 

02.

Focused on function rather than mechanism

Writing code is generally a time consuming and repetitive process. Designing a synthetic model with spreadsheet eliminates the need to write code and allows the user to focus on expressing the model’s desired behavior which can later be employed as the operation mode using the same spreadsheet. 

03.

Simulation to operation 

Our simulation software utilises the same systems and cloud infrastructure as the Smart Microgrid Controller (SMC); supporting an instant swap of a simulation with a real entity. This is particularly advantageous when simulation is employed to establish the appropriate operation configuration prior to commissioning of an additional DER.

Create synthetic entities quickly and easily 

XXXX

Model requirements  

The process of outlining the synthetic model’s behaviour in an spreadsheet essentially produces the synthetic model itself which consequently, streamlines the whole model construction process by merging the spec requirements and model design processes into one seamless step.

Policy design

Spreadsheets are based on the Directed Acyclic Graph mathematical model which is particularly well suited to constructing policies for microgrid management systems.

Data integration

Spreadsheet can subscribe to inbound data streams from other devices, the internet or utilise historic data to influence its own policy decisions.

Spreadsheet to Python code

Policy module plug-in runs the spreadsheet as compiled python. Policy modules can run anywhere within the SMC cloud or the physical host devices (SMC Mediation Device).

Run the model 

The data streams from the spreadsheet create live dashboards, reports and alerts that are identical to the ones from a real entity (i.e. generator, consumer, sensor etc…)

Example: Simple Wind Turbine

A simple synthetic model can be achieved relatively quickly. For example, we can run a basic Wind Turbine (WT) model by knowing the power curve and the wind speed data to feed the model. A more intricate WT model could be designed with multiple spreadsheets, each addressing a specific components or attribute (e.g. availability, scheduled downtime, grid constraints etc...) to produce a more realistic WT simulation.

Online

Data from a real sensor

Live data stream from sensors drives the synthetic model e.g. anemometer 

Captured data

Historic data feeds into the model

Stored wind speed (m/s) from can be used to model a wind turbine performance at a specific location 

Policy

Spreadsheet formula

A polynomial formula is produced from the power curve table which can be used in a spreadsheet cell to generate power (kW) from the wind speed (m/s)

Spreadsheet can also include other data such as: 
• Conditions (Export limits),
• Parameters (Turbine availability), and
• Other excel functions

Mobirise

The MQTT data streams produced by the synthetic WT spreadsheet will generate the dashboards, reports and alerts identical to the data streams expected from a real WT. The user can test various configurations to establish the perfect match for their requirements, for example:  
   - To maximise the use of renewable energy, or
   - To minimise the Levelised Cost of Electricity (LCOE). 

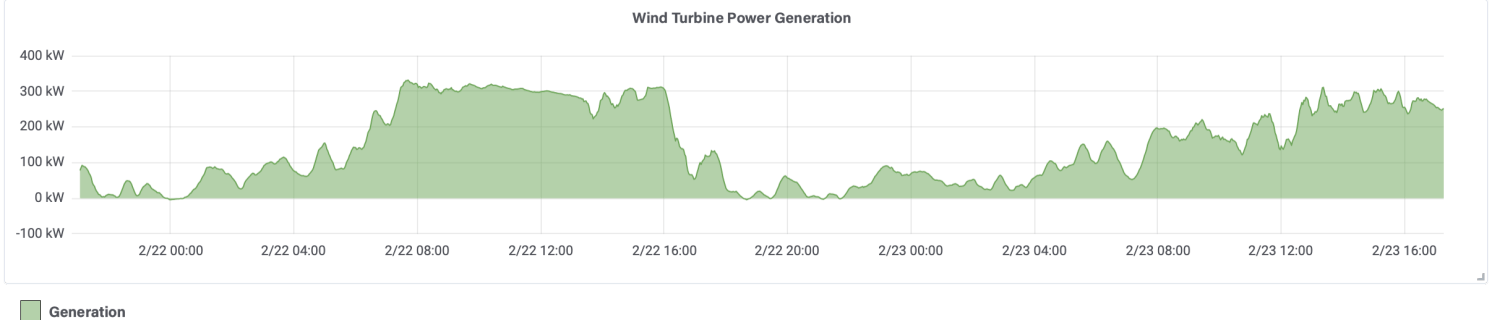
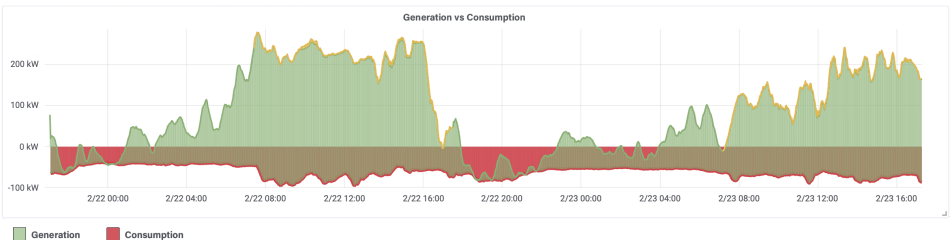
The results of such configuration experiments are instantly available as graphical visuals and numerical reports. For instance, the pictures below illustrate the correlation between the synthetic WT generation vs the live consumption of a particular site. The red areas below 0 represent the consumption and the green areas represent the generation. 

Mobirise

Power Generation

Real time ‘Active Power’ panel from the synthetic WT.

Mobirise

Generation vs Consumption 

Overlay the WT generation with real time consumption to visualise how much of the consumption will be supplied by renewables.

CONTACT US

© Copyright 2022 Smarter Microgrid Ltd - All Rights Reserved